Precision agriculture

See what is happening in your field and decide where to act.

We combine satellite imagery, aerial photography, soil, water and terrain data, and field visits to know which parts of each field are changing, since when, and where to act.

For orchards and field crops in New Mexico, Chihuahua and other regions. The examples on this page come from pecan orchards.

How we help

  • See what is changing

    Satellite and aerial imagery, with years of history, to spot which parts of the field are changing.

  • Understand why

    Terrain, soil, water and weather on the same map.

  • Decide where to act

    Management zones and sampling points to know where to act.

  • Check in the field

    Field visits and laboratory analysis to confirm every signal.

The service grows with every crop: we add new data sources and analyses as they are needed.

See what is changing

Spot early which parts of the field are changing.

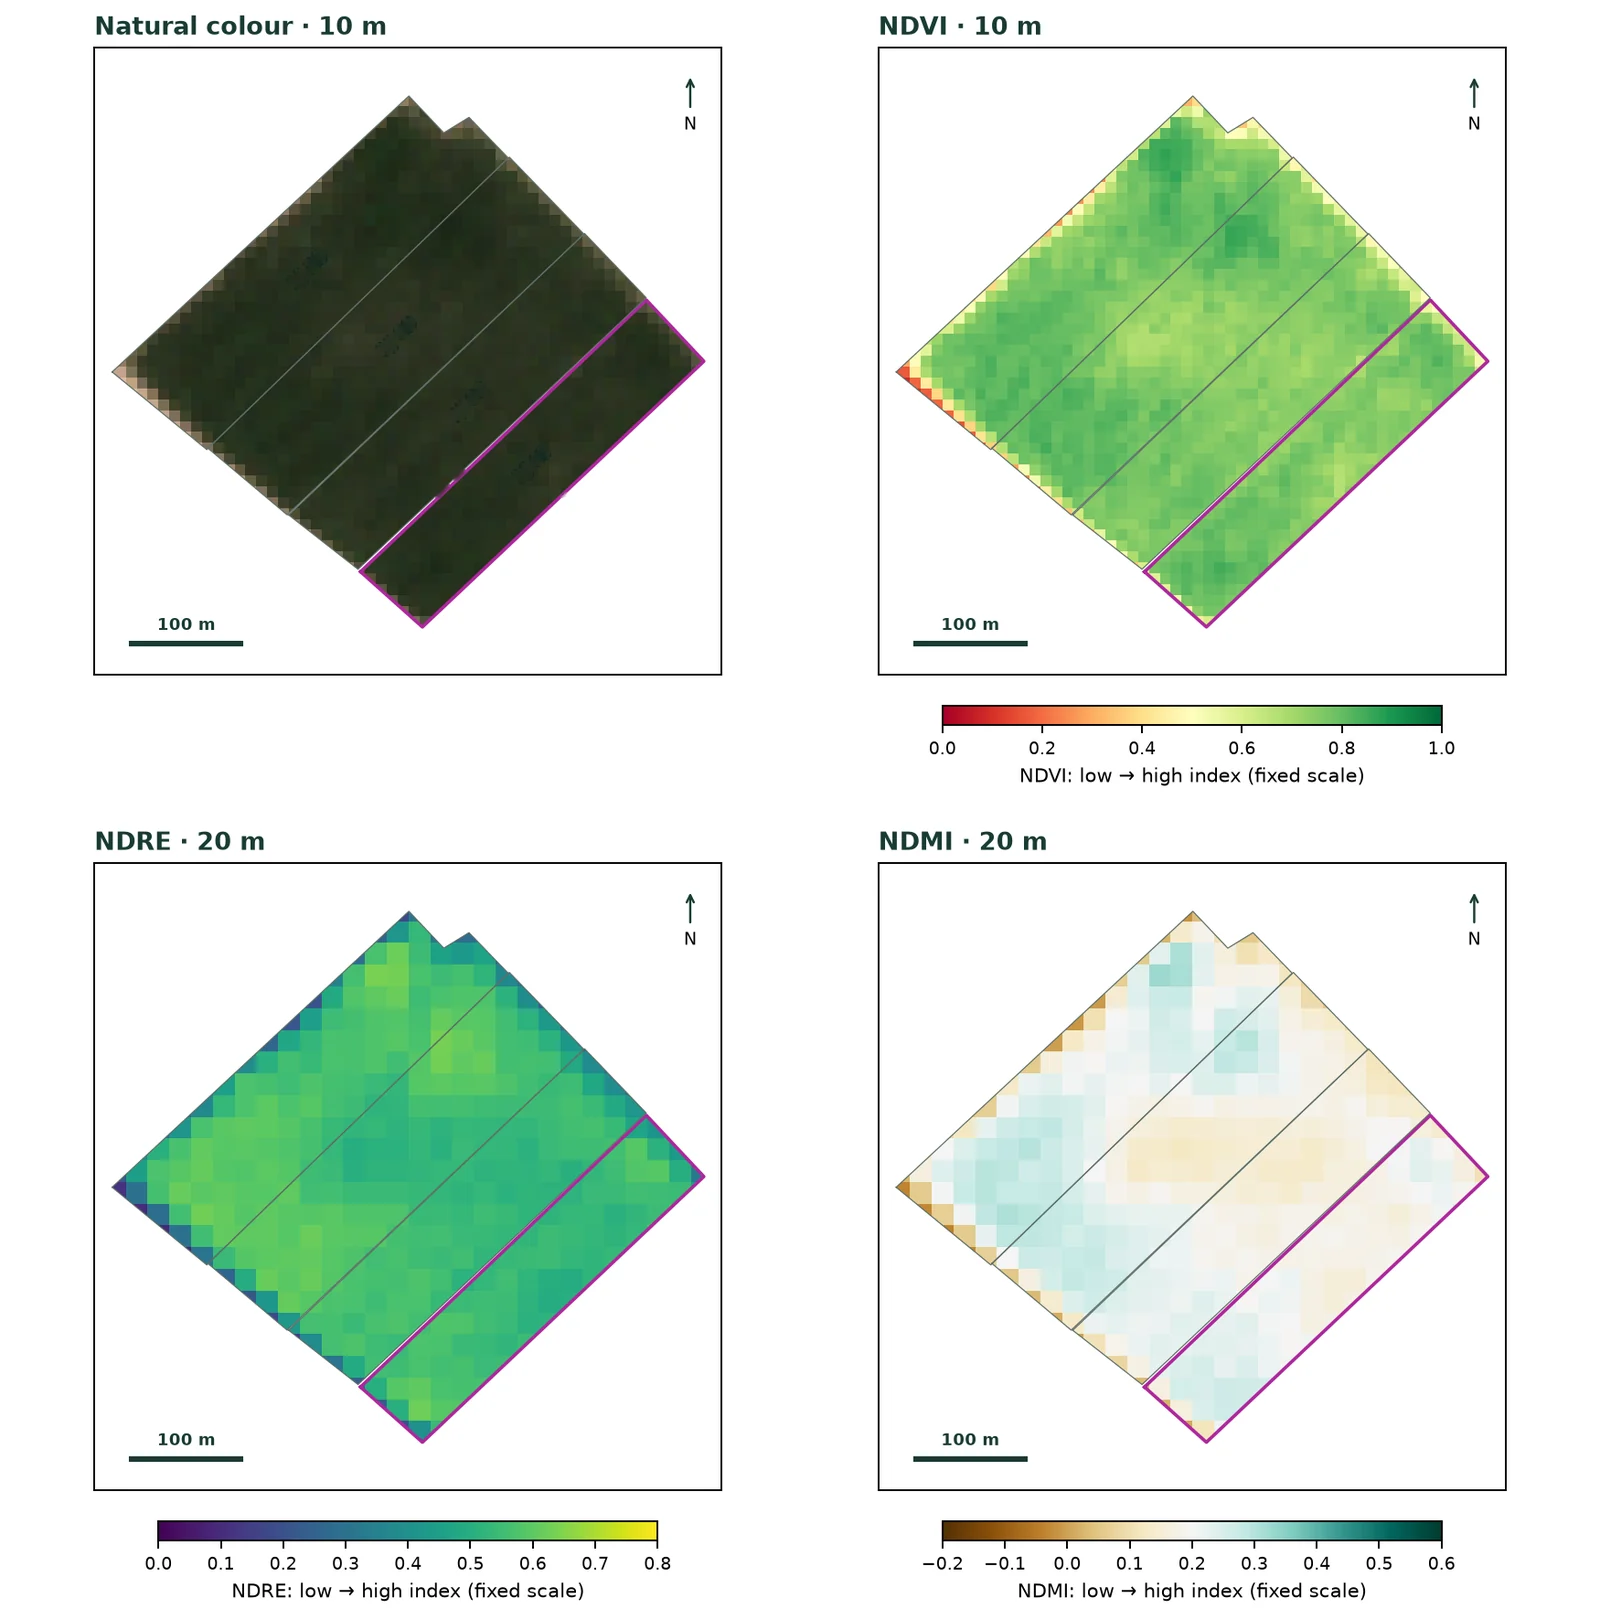
Pecan block in four Sentinel-2 panels: natural colour, NDVI, NDRE and NDMI.

01

Vigour, leaves and moisture across the field

Every usable satellite image becomes vegetation-index maps: greenness, leaf response and moisture. Clouds and shadows are filtered out first, so only real changes are compared.

  • Vegetation indices
  • NDVI · NDRE · NDMI
  • Cloud filtering
Open full-size image
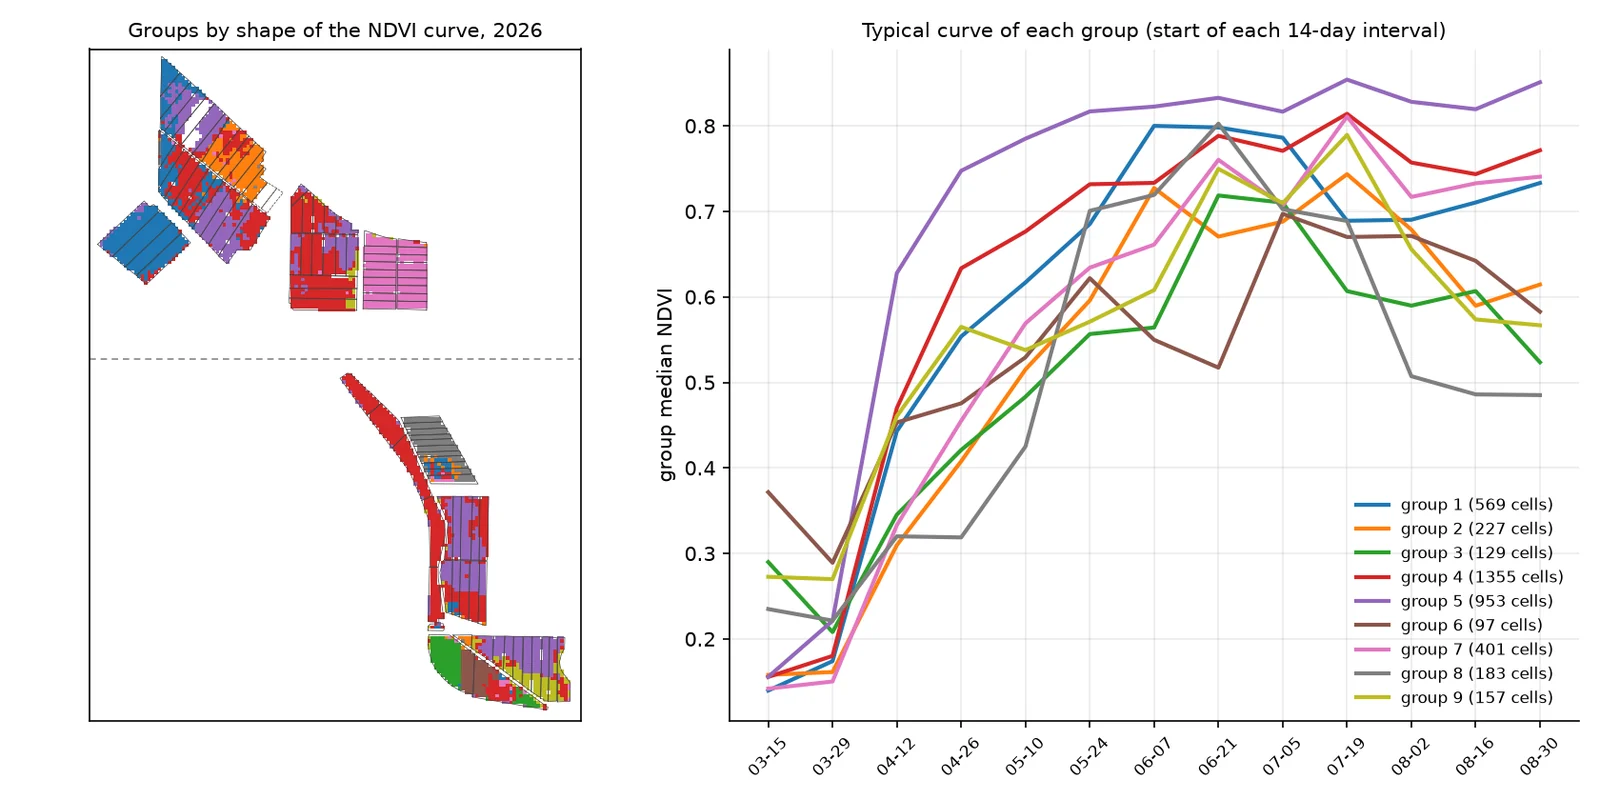
Map of groups by NDVI curve shape and a chart with the typical curve of each group in 2026.

02

How each part moves through the season

We group parts of the field by how their vigour evolves over the season: those that start early, fall behind or drop mid-season, even when their averages look alike.

  • Time series
  • Clustering
Open full-size image

Understand why

Many differences are explained by history and terrain.

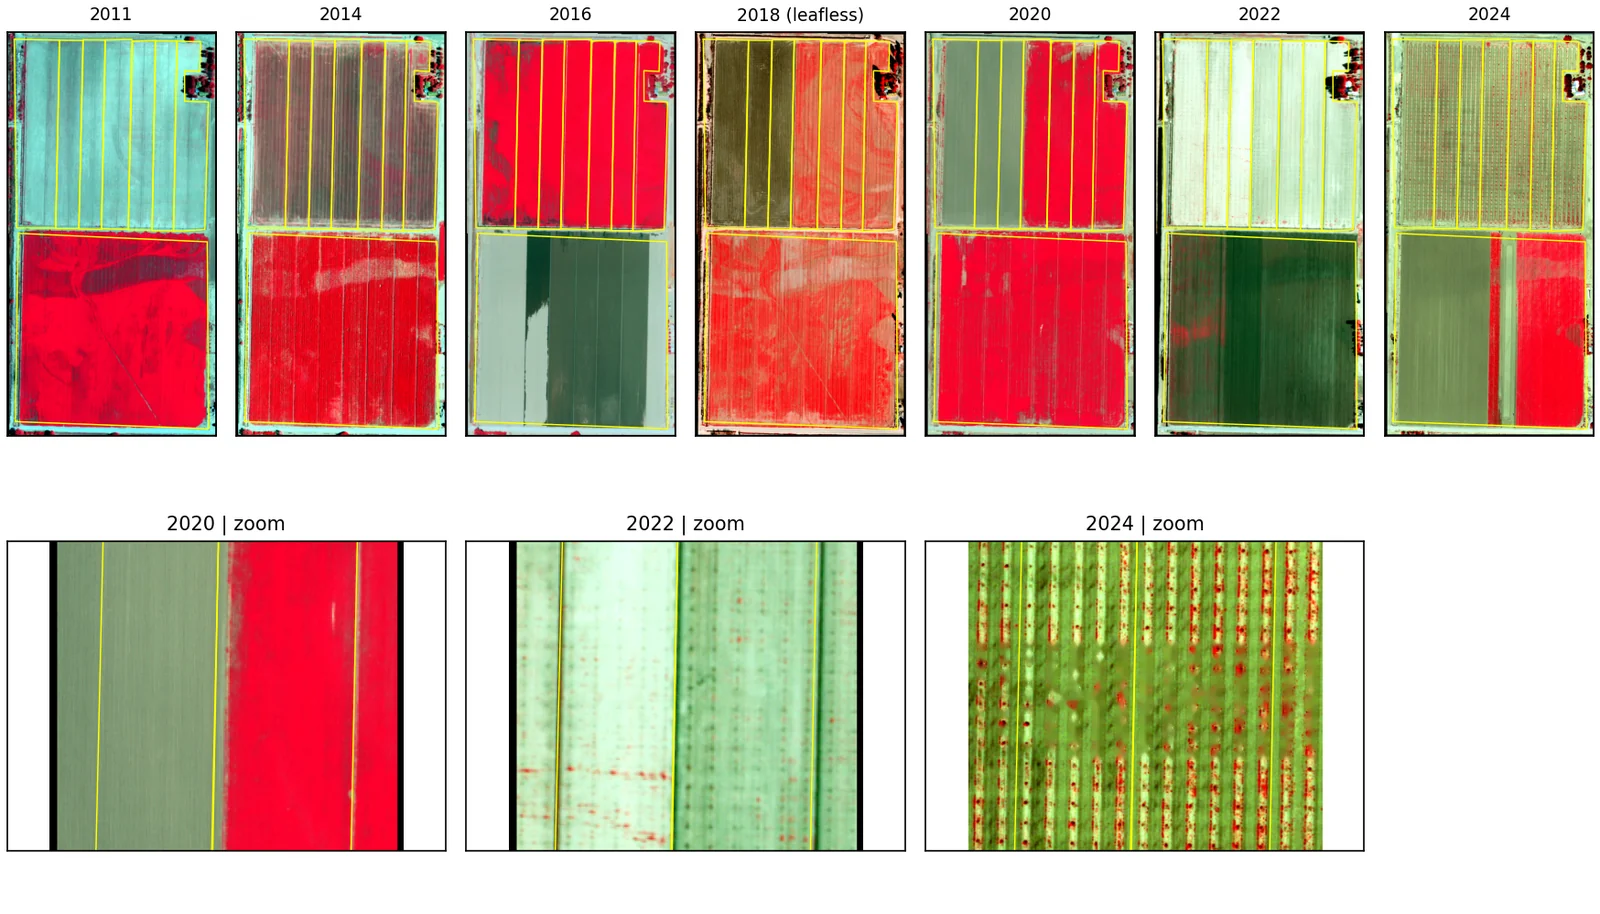
Series of colour-infrared aerial photos from 2011 to 2024 with zooms for 2020, 2022 and 2024.

03

The field's history in aerial photos

Aerial photo archives from several years date plantings, replants and crop changes in each part of the field.

  • Aerial photography
  • Colour infrared
  • Historical series
Open full-size image
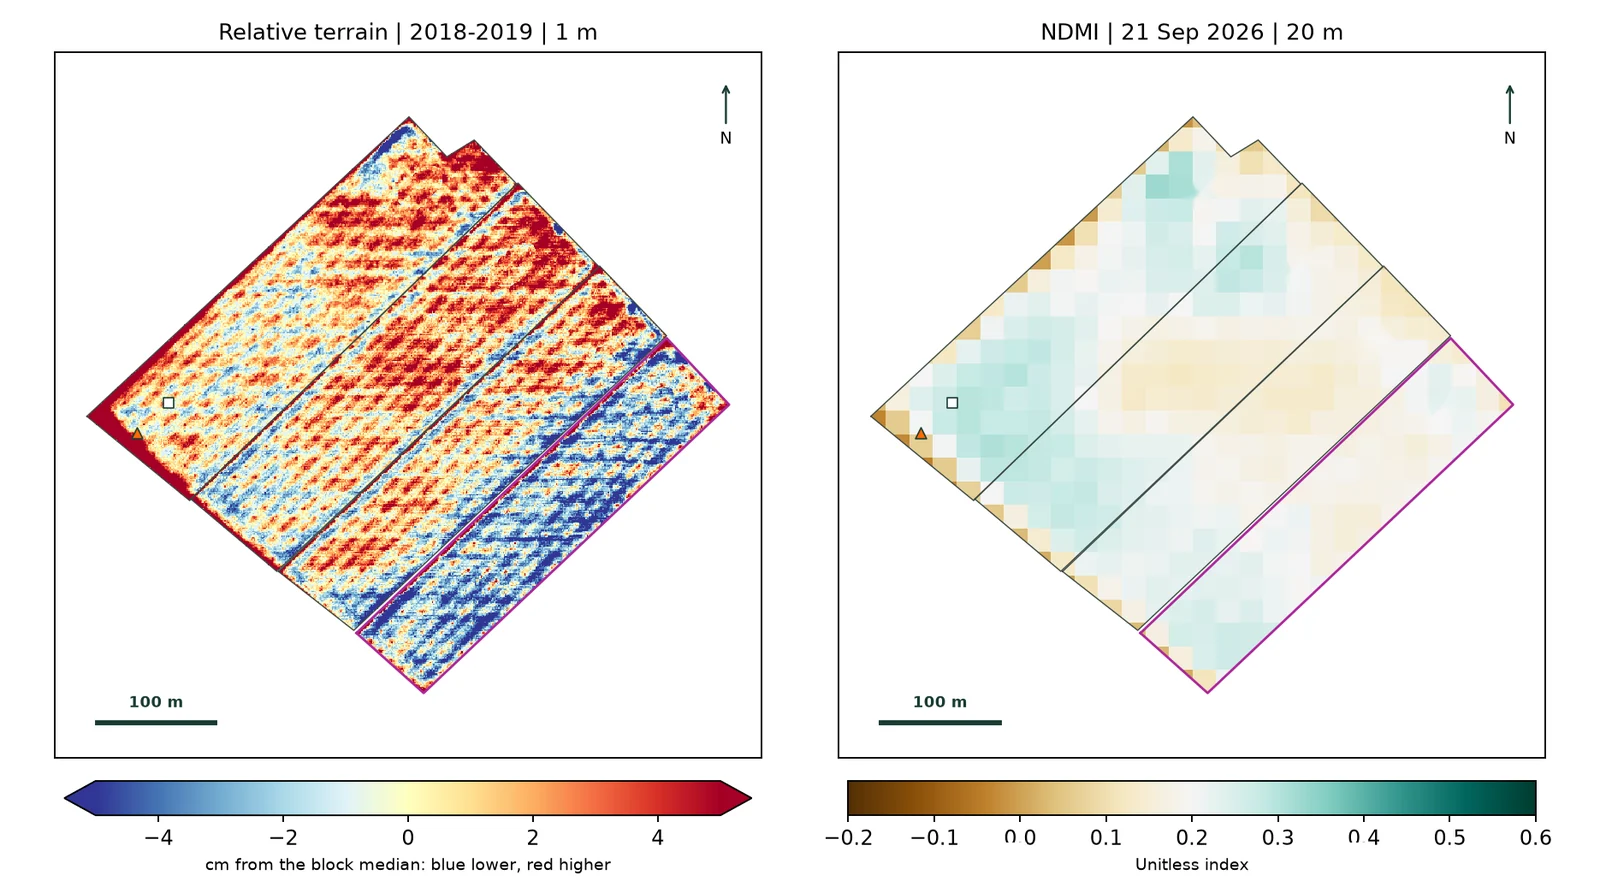
1 m relative LiDAR terrain map next to the NDMI map of the same block.

04

Terrain and moisture, side by side

Detailed elevation models show hollows where water collects and high spots it reaches less, and whether the vegetation follows the terrain.

  • LiDAR
  • Relative terrain
  • Vegetation moisture
Open full-size image
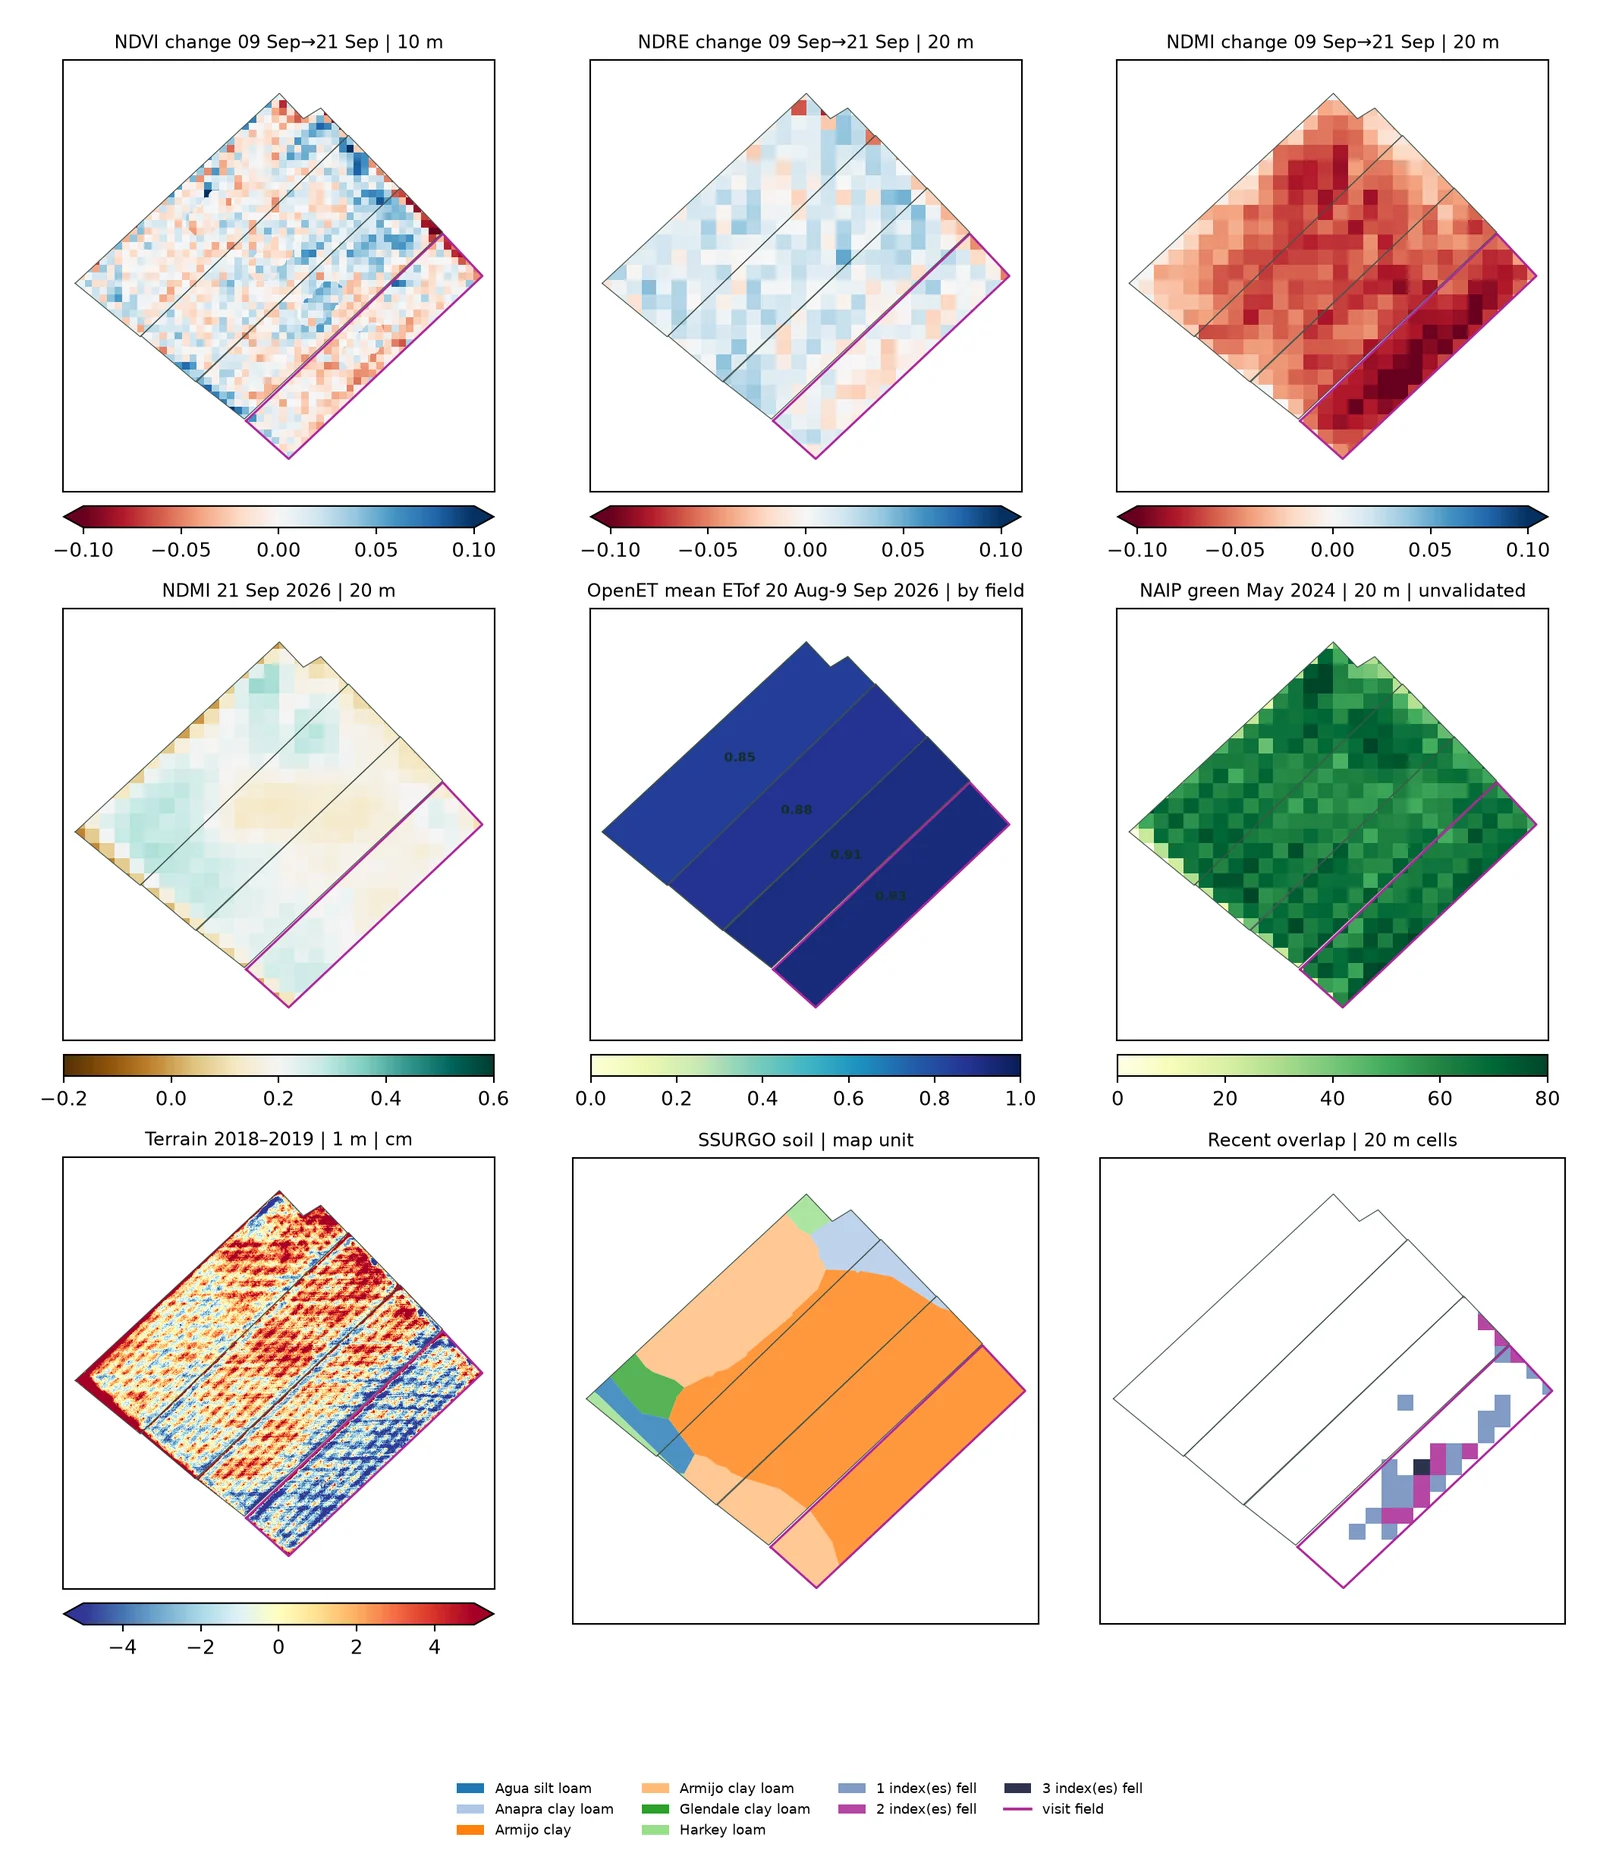
Nine maps of the same pecan block: NDVI, NDRE and NDMI change, NDMI, OpenET, aerial green cover, LiDAR terrain, SSURGO soil and coincidences.

05

Every layer on the same map

Changes in vigour and moisture, evapotranspiration, aerial cover, terrain and soil, together. The last map marks where several signals agree: that is where the visit starts.

  • Vegetation indices
  • Evapotranspiration
  • Terrain
  • Soil maps
Open full-size image

Decide where to act

From a patch on the map to what to do about it.

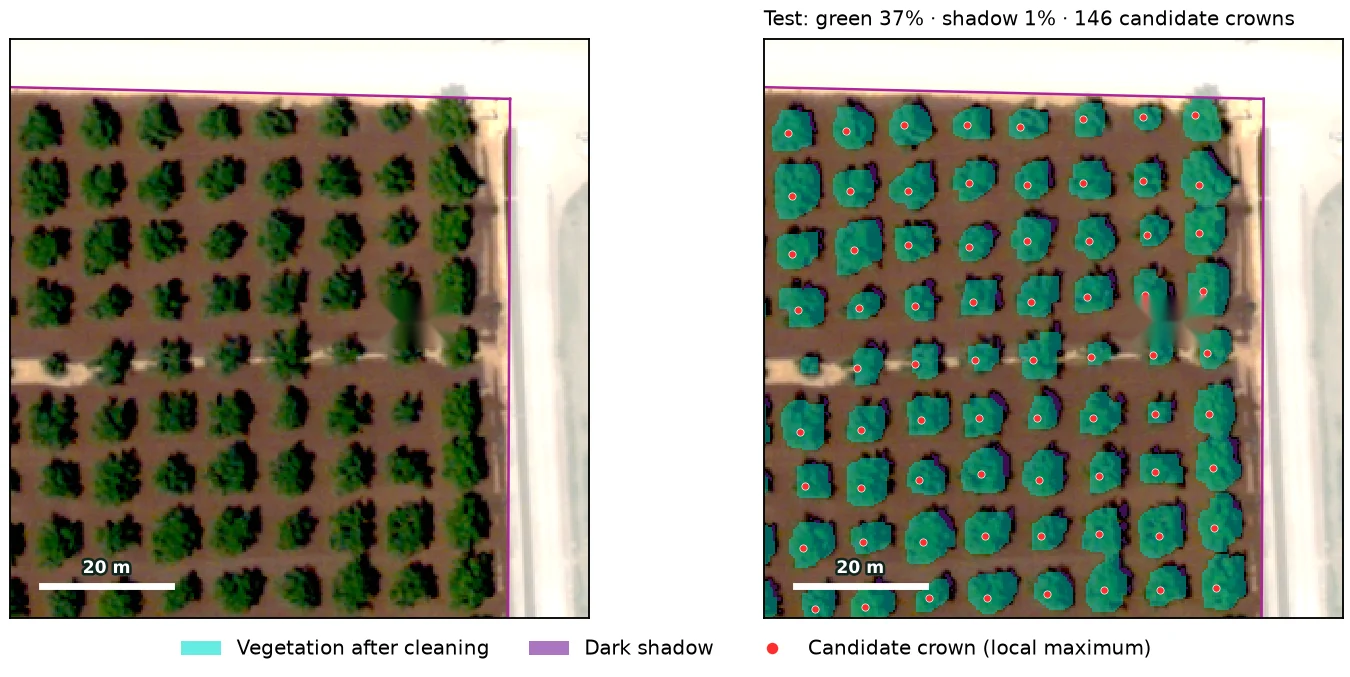
Aerial photo of a pecan orchard and the same photo with the canopy mask and every candidate crown marked.

06

Tree counts and canopy cover

In orchards, aerial photos separate soil, shadow and vegetation and locate every tree: gaps, small crowns and cover by block.

  • Aerial photography
  • Vegetation mask
  • Crown detection
Open full-size image
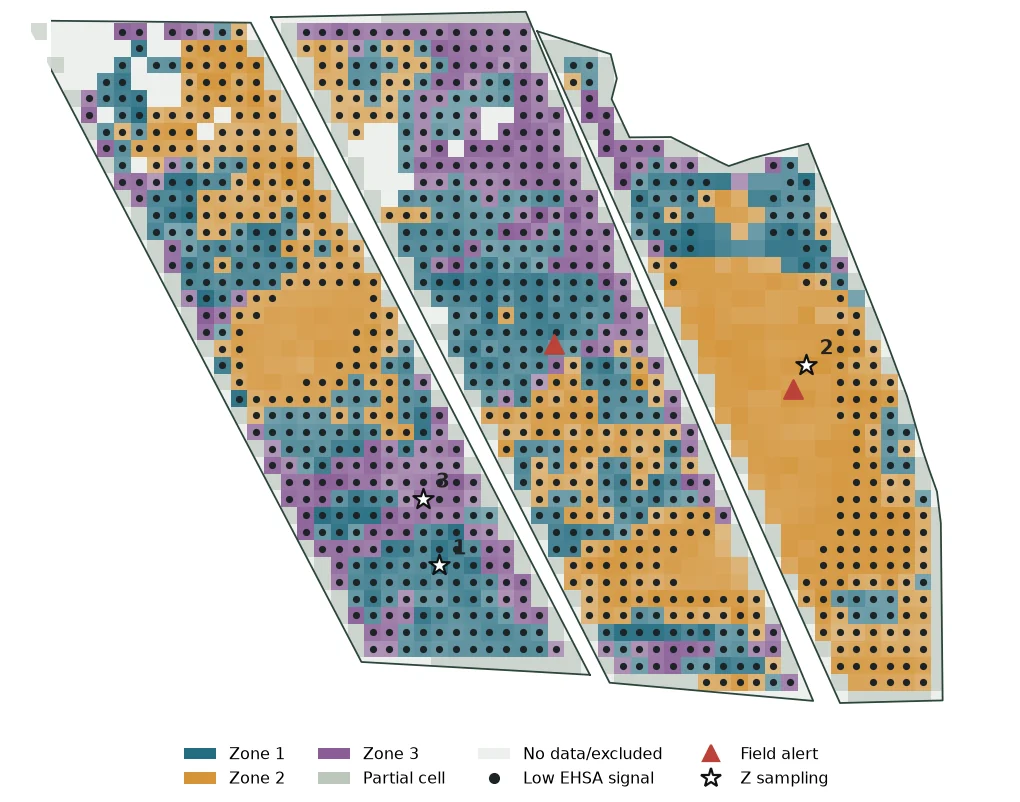
Map of three candidate management zones with EHSA signals and sampling points.

07

Management zones

We combine history, vigour and terrain to split the field into zones that behave alike and hold year after year. Each zone gets a representative sampling point.

  • Multivariate analysis
  • Spatial clustering
  • Sampling by zone
Open full-size image

Check in the field

Every signal is confirmed on the ground.

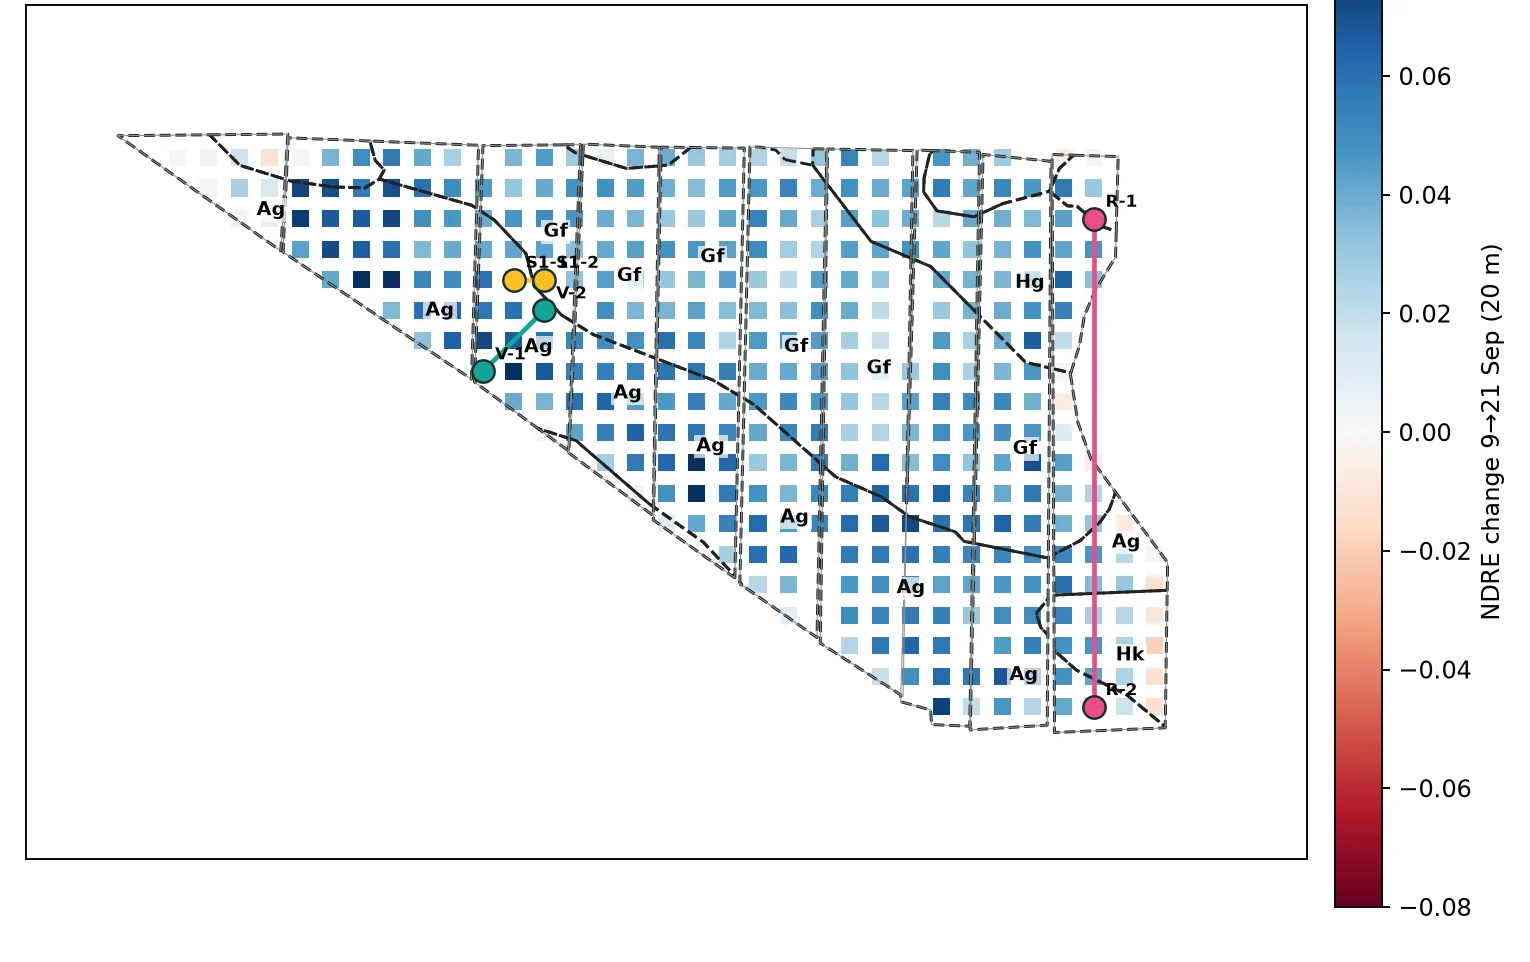
NDRE change by cell with soil-unit boundaries and paired sampling points.

08

Targeted sampling

We suggest where to sample to answer a specific question, such as comparing two soils, or a part that changed with one that did not. That way every laboratory test helps a decision.

  • Soil maps
  • Paired sampling
  • Laboratory
Open full-size image

From satellite to field

Every analysis ends in a specific field visit.

  1. Step 1

    Reliable data

    Only imagery and data that pass quality checks.

  2. Step 2

    Analysis

    Indices, history, terrain, soil and zones in one frame.

  3. Step 3

    Field visit

    A route to the sites most worth checking.

  4. Step 4

    Laboratory

    Every sample is tied to its site and date to confirm the signals.

Depending on the project, it can include

Maps and report

A per-field summary in English and Spanish: what changed and where to act.

Visit route

The sites to check, in order, with the reason for each stop.

Sampling points

Where to take samples and what to measure at each one.

Technical detail

The methods behind every map, for anyone who wants to review them.

Some of the data sources we use

  • Satellite imagery
  • Aerial photography
  • LiDAR
  • Soil maps
  • Evapotranspiration
  • Weather stations
  • Laboratory samples

Some of the methods we use

  • Vegetation indices
  • Time series
  • Spatial analysis
  • Management zones
  • Tree detection
  • Artificial intelligence

Next step

Want to see your field like this?

Tell us what you grow, where it is and how it is irrigated. We will show you which analyses apply to it.